GLIDE-Graph
UI Framework for any PLM system
A graph-based formalization is an operational representation of PLM data that help with a better understanding of any underlying problem in your product lifecycle.
Our framework provides feature rich graphical components along with fully functional spreadsheet like capabilities that guarantee a pleasant user experience. It empowers your users to get more done. We support Cloud and On-Premise deployments.
- Lack of responsive UI to perform mass updates
- Too many clicks to get to the information one needs
- Too many pop ups all over the place. I am lost!
- Takes too long to perform a job
- Missing insights regarding dependent data leads to incorrect decisions leading to costly rework
- Simple things take a while
- User Interface not intuitive
PLM User Grievances
Result: Users find reasons, alternatives and ways to not use the application
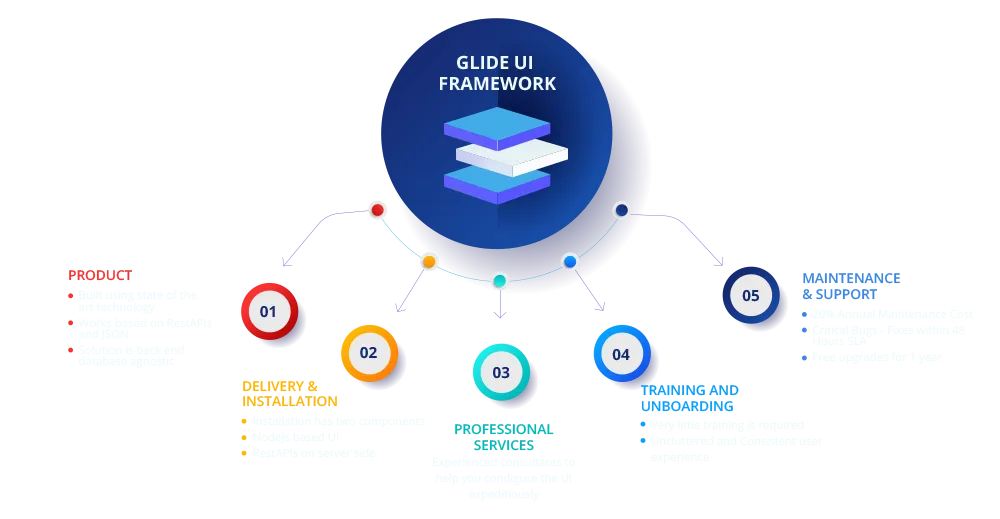
Glide Graph Framework UI
Graph Based with fully function CRUD operations
Spreadsheet capability to manage large data sets
Built using state of the art technologies
Glide UI Framework puts your data in Plain Sight
Features
Intuitive and Expressive
- A user is able to do things within the system in perspective
- Users are able to view the connected information that they need
Concept of views
- Different content need different views
- Graphs visually helps users track dependencies and provides contextual insights
- Tracks history of objects and keeps it persistent
Context aware components
- Contextual Data Authoring
- Honors authorization protocols of the PLM vendor
- Takes a proactive view as opposed to a try your luck approach
Process-directed user interface
- Reduces training costs
- UI is proactively rendered without user having to wonder what to do next
- Helps analyze, easily detect and investigate insights hidden in graph data
- Spreadsheet like capabilities to Sort, Filter, update large amount of data real time
Information & knowledge centric view
- Data is logically grouped into information and presented to the users
- Arrangement of nodes and edges as a narrative
- Provides clarity of content
Promotes graphical management of information
- Quickly find the information you need with interactive graphs
- Filter graph visualizations to work on specific elements or specific sections of data
- Helps analyze, easily detect and investigate insights hidden in graph data
Used by 4000+ Design Engineers
"What took 5.5. hours previously takes me only 20 minutes now - huge productivity gain"
-A Design Engineer